For each aqueduct, the classical and modern name(s) of aqueduct destinations are given, and links to relevant literature. The geographic position of the destination and, where known, the approximate trace of the aqueduct channel, are shown in Google Maps. The ROMAQ team is constantly updating the database, and the aim is to also provide information on technical aspects of the aqueduct, although this is a long-term project.
- You are here:
-
Home

- FAQ

What does the database show?
Who has set up the database?
The database has grown over a number of years around an original core organized by Wilke Schram, and was subsequently expanded by Cees Passchier, Driek van Opstal and Wilke Schram. A substantial amount of Italian references were provided by Mario Parise of the sister project "carta degli antichi acquedotti italiani" of the Società Speleologica Italiana.
Who is responsible for the content of the database?
The ROMAQ team has collected references, searched for links to specific aqueducts in the references and set up the database. We try to present material as accurate as possible, and are constantly expanding, improving and screening the content. However, there will still be errors in the presentation. We greatly welcome any suggestions for improvement, changes and additions –please contact the ROMAQ team – we are very grateful for your input.
How can I use the ROMAQ database?
We assembled the material in this database to stimulate research on roman aqueducts and protection of the remains. The database is therefore meant for research and may be used free only for non-commercial purposes. The aqueduct traces on the maps are our own and can be used with permission from the copyright owner, referred to as ©2004 - 2011 Cees W. Passchier
Are all roman aqueducts treated in the database?
We try to find all relevant literature on the major aqueducts constructed in the Roman Empire, mainly those serving towns and cities. We think that we have localised most of these. There are probably also thousands of small aqueducts serving villas, farms, fish farms and mines, and it is presently not possible for us to treat them all. We did include, however, the most important and famous aqueducts to a number of villas and mines. Also, in many cases, aqueducts have a long history and have been set up before Rome exerted political influence in a certain area. Commonly, the exact age of an aqueduct is not even known. We have therefore included several older and younger aqueducts in the database.
Why only roman aqueducts?
As mentioned above, we also treat some older and younger aqueducts, but in our experience, the period of greatest building activity of aqueducts in the Mediterranean area was in the first two centuries of our modern era, during the early imperial period of the Roman Empire. We therefore concentrate on this period.
Why did the Romans build all these aqueducts?
Aqueducts were built for several reasons. The most important one was, surprisingly, not the need for drinking water; wells and cisterns could in most cases provide this. Bathing was a major element of roman culture, and baths need running water, and a lot of it. The mean reason for building most of the aqueducts was therefore to provide roman baths with fresh, running water. Of course, drinking water was also supplied in this way, and this was without doubt the second important reason to build these structures. A third important reason, like in modern times was prestige and political influence; many aqueducts were built because neighboring cities already had them, and many were financed by rich roman citizens who wanted to expand their influence, commonly the Emperor himself. Aqueducts were expensive structures to build, and the undertaking of building one can only be compared with building an airport nowadays.
Why did the Romans build aqueducts when their city was on the bank of a river?
Although many roman sites are situated on the banks of rivers, the water level in these rivers was not high enough to supply water to baths and fountains inside the city; there were no pumps to raise the water level. Water therefore had to be obtained from higher up the same river, or from other sources. In most cases sources and drainage galleries were preferred as a source of water over rivers, simply because the water level in rivers varies strongly, and the water can be contaminated by human waste and by mud in case of heavy rain; sources and drainage tunnels are more reliable and usually give a contant supply of clean water year round. Roman aqueducts must have contributed significantly to health of the population and indirectly to economic prosperity. In most cases, the sources that serviced the roman aqueducts are still used by modern towns in the same area.
What do the green lines on the maps mean?
The green lines represent the approximate trace of the aqueduct channel, the "specus", in the terrain. Water ran through the aqueducts by gravity, so the aqueduct channel, indicated by the green line, transported water from the source to its destination. We indicated the destination with a symbol, but not the source; in this way, the current direction in the aqueduct is indicated. Notice that in some cases, no destination is given; in such cases, the destination of a stretch of canal is simply unknown.
Do the maps show details of the aqueducts such as bridges, siphons, basins etc?
Because of the number of objects and technical restrictions of Google Maps, we cannot presently show details such as bridges, siphons, tunnels etc. The aim is to show these on maps in a printed atlas, produced by the ROMAQ team
What is the accuracy of the position of aqueduct destinations, and of the aqueduct tracks on the maps?
The destinations are normally given as the geographic centre of an ancient site, or the most visible remains, such as a theater; it is not necessarily the final water distribution structure of the aqueduct channel itself, since the position of these is in most cases unknown.
The accuracy of the position of aqueduct channels is strongly variable, since it depends on the accuracy of maps in the published literature. The green line is simply our best estimate of the position of the aqueduct channel. We are improving the accuracy of these tracks wherever possible.
Since aqueduct channels are nearly always highly curved, following contour lines, it is relatively easy to judge the accuracy of a certain aqueduct trace on our maps; a highly curved track with many nodes is more accurate than a straight one with few nodes. In some cases, where only source and destination are known, the aqueduct channels is simply indicated as a straight line connecting both, although the real track must have a more complex shape.
Where is the literature mentioned in the reference list?
The literature on roman aqueducts is published in books, journals, monographies and theses, most of which are difficult to find. We are therefore building a digital repository, named the Thomas Ashby Digital Repository (TADIR) which will contain pdfs of all the publications which we can find. Presently, we have more than 2000 references in the depository. The reference pages of the ROMAQ site indicate which papers we have as a copy (copy in repository). You can help us by sending us pdfs or photocopies of material which we do not have. We cannot publish the repository because of copyright restrictions, but will try to help researchers who need acccess to certain individual texts.
Why is it called an atlas project? Where is the atlas?
We are presently only presenting a small amount of the data we have collected on the subject, and our ultimate aim is to publish a real, paper atlas of the known remains of roman aqueducts, including the type and location of bridges, siphons, basins etc. Obviously, this is a major undertaking and this ROMAQ website is a first step in realization of the Atlas project.
The "Atlas of Roman Aqueducts" will contain summarized information on the history and technical aspects of each aqueduct, maps and photographs. Because of the large number of aqueducts on which data is available, each aqueduct will be covered by a maximum of two pages. Addition photographic and map material will be published in the ROMAQ online database. An example of a page from the Atlas and of a map are shown below.

Example of a page from the Atlas of Roman Aqueducts

Sample map from the Atlas of Roman Aqueducts
Why in English?
We presently have references in 23 languages, and it would be nice to present this material in the same languages on the site. For practical reasons, however, we have decided to make English the core language of the database.
Can we upload our own data?
Because the structure of the database should be uniform, we decided against a platform to upload data directly. However, we do welcome any input for the database. We prefer published data and theses to unpublished material. In some cases, where no published material is available, we have also included unpublished manuscripts and maps
Any relevant data or proposed changes should be sent to the ROMAQ office, either by email or on paper. For large files, please use one of the transport file sites like mailbigfile (http://www.mailbigfile.com/ ), transferbigfiles (https://www.transferbigfiles.com/) or yousendit (https://www.yousendit.com/).
Are websites accepted as data?
We prefer to refer to data published in books and journals for the simple reason that it is permanent; websites may contain very interesting and reliable material, but they commonly disappear after a number of years, or their content is changed. We do refer to important websites in the database, though.
What data are needed?
What we need for ROMAQ are data as described below. We realise that you may not have all of this, and the list is only meant as a mnemonic, to indicate what we would like to use in ideal cases. In fact, any info that you can send us is useful for us. It will be transferred into our ROMAQ website, and to the Filemaker database on which ROMAQ is based. The language of ROMAQ is English, but you can fill in the data in any language that we can handle comfortably, i.e. Dutch, German, English, French, Italian, Spanish, Catalan, Portuguese and Turkish
- relevant literature. Best are PDF files of articles, or .jpg or .tiff files of individual pages, or also photocopies to be sent to our mail address
- large scale data on the aqueduct such as length in km, dimension of the specus (width and height), estimated delivery volume (cubic metres/day), and gradient
- data on elements of the aqueduct, such as type of source (spring, river, dam, lake,...), name and location of the source, capacity of the source now (m3 per day), shape of the specus ( masonry canal, tubes, etc), shape of the specus covering (half -circular vault , cover slabs), presence of special elements (siphons, tunnels , bridges), presence of basins and presence of sinter in the specus
- a short description of remains that can still be seen, and where they are, including the type of element (specus remains, wall, bridge, basin, etc), a short description, GPS coordinates or indications of locations and a map or .kml or .kmz file showing the position of the remains
- photos of the remains – these will only be used for a better description and not be published, except when it is needed for the website and if the owner gives permission.
How can I build .kml or .kmz location files using Google Earth?
If you wish to send us locations of aqueduct remains, or the trace of an aqueduct on the ground, you can send us a drawing or map, but the best and easiest way is do to mark locations or traces of aqueducts in GoogleEarth. This is done as follows, once you have installed GoogleEarth on your computer:
Enter a location
- Open Google Earth
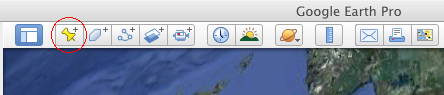
- to enter an element as a single point, called a "place mark" in Google Earth, click the yellow pin in the bar above the Google Earth Window. The pin will appear on the Google Earth Globe and a window will open where you can enter your data; zoom in on the map until you can recognise features in the area where the element is located, and drag the pin to the right position. If you know the coordinates, you can also type those in and position your pin this way.
- press "description" and enter the name of your element under "Name", and insert the text you want to give to describe it in the field "description". Here you could describe the item, give measures, references etc.
- check that the pin is the right position, and if so, press OK.
The placemark will now appear in the "places" list at the left side of the globe. When you prepare several elements, please add a Folder under the Google Earth menu "Add" and place all your elements in the folder by dragging them in.
- if you have saved your element, but want to make further changes, edit it by clicking on it in the "places" list with the right mouse button. Alternatively, you can click on it with the right mouse button in the map itself, and choose "get info" in the dropdown menu.
- remove elements by activating them, then press "delete"
- save what you did under "file>save>save my places". Note that GoogleEarth does not automatically save your work.
Drawing an aqueduct track
Drawing an aqueduct track will be done by the ROMAQ team, using the data you provide, but in some cases, e.g. if you can remember the locations in the terrain, but cannot find it on a map, it may be better if you draw sections of the aqueduct yourself. You can proceed as follows:
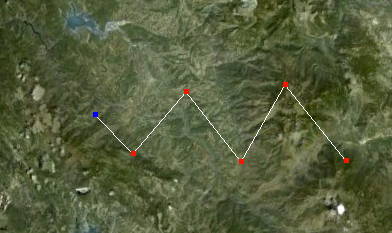
- click the three blue dots in the bar above the Google Earth Window. This will create a "path"
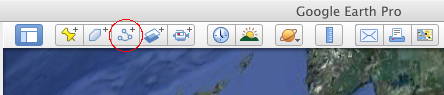
A white square will appear on the Google Earth Globe as a cursor; enlarge the field of view until you can recognise features in the area where the element is located, and click to outline your aqueduct path. Active nodes are blue, and you can drag these around; activate other nodes by clicking on them with the mouse. You can add nodes in the line by clicking, activating the node next to the place where an extra node is needed (in fact, before it in the sequence in which the nodes were first inserted). You can remove active (blue) nodes with the right mouse button.
- press "description" and enter the name of your aqueduct under "Name", and insert the text you want to give to describe the aqueduct it in the field "description"
- check that the aqueduct path is the right position, and if so, press OK.
The aqueduct track will now appear in the "places" bar at the left side of the globe as a white triangle. You can add a Folder under the Google Earth menu "Add" and place all your elements in the folder by dragging them in.
- if you have saved your aqueduct, but want to make further changes, edit it by clicking on it in the "places" bar with the right mouse button. Alternatively, you can click on it with the right mouse button in the map itself, and choose "get info" from the dropdown menu.
- remove paths by activating them, then press "delete"
- save what you did under "file>save>save my places". Note that GoogleEarth does not automatically save your work.
Saving and sending
Once placemarks, polygons or tracks are complete and stored in a folder, please select the folder in the "Places "list at left and save it under "File>Save>Save Place as". Save the folder as a .kmz or .kml file. Send this file to APRA as an attachment to an email. In the email, you can give further explanation. We will add the material to the existing databases, with a reference to your contribution as an acknowledgement. Any photographs you send remain your property and under your copyright.
ROMAQ emails:
This email address is being protected from spambots. You need JavaScript enabled to view it.This email address is being protected from spambots. You need JavaScript enabled to view it.
Postal Address:
ROMAQProf. Cees W. Passchier
Tannenstrasse 7
55576 Zotzenheim
Germany
Fax 1:+49-6701-901803
Fax 2+49-6131-3923863